 Image 1 of 4
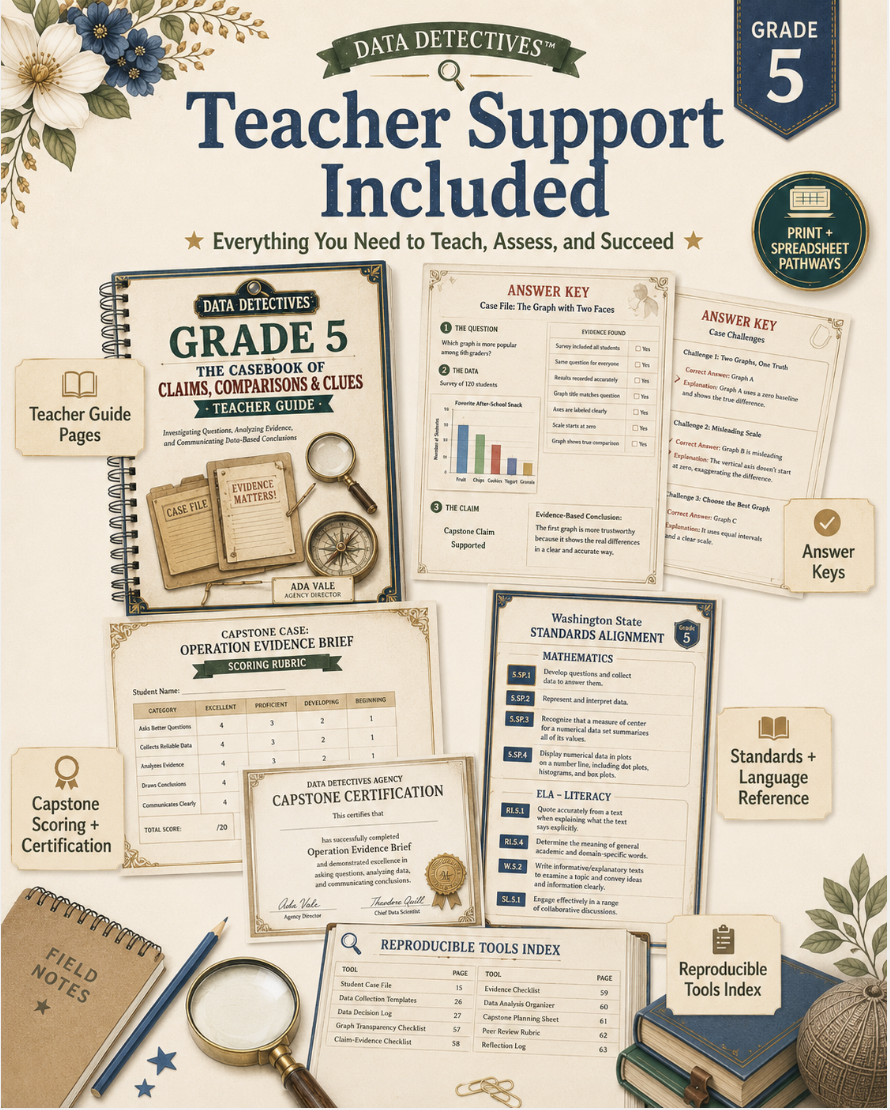 Image 2 of 4
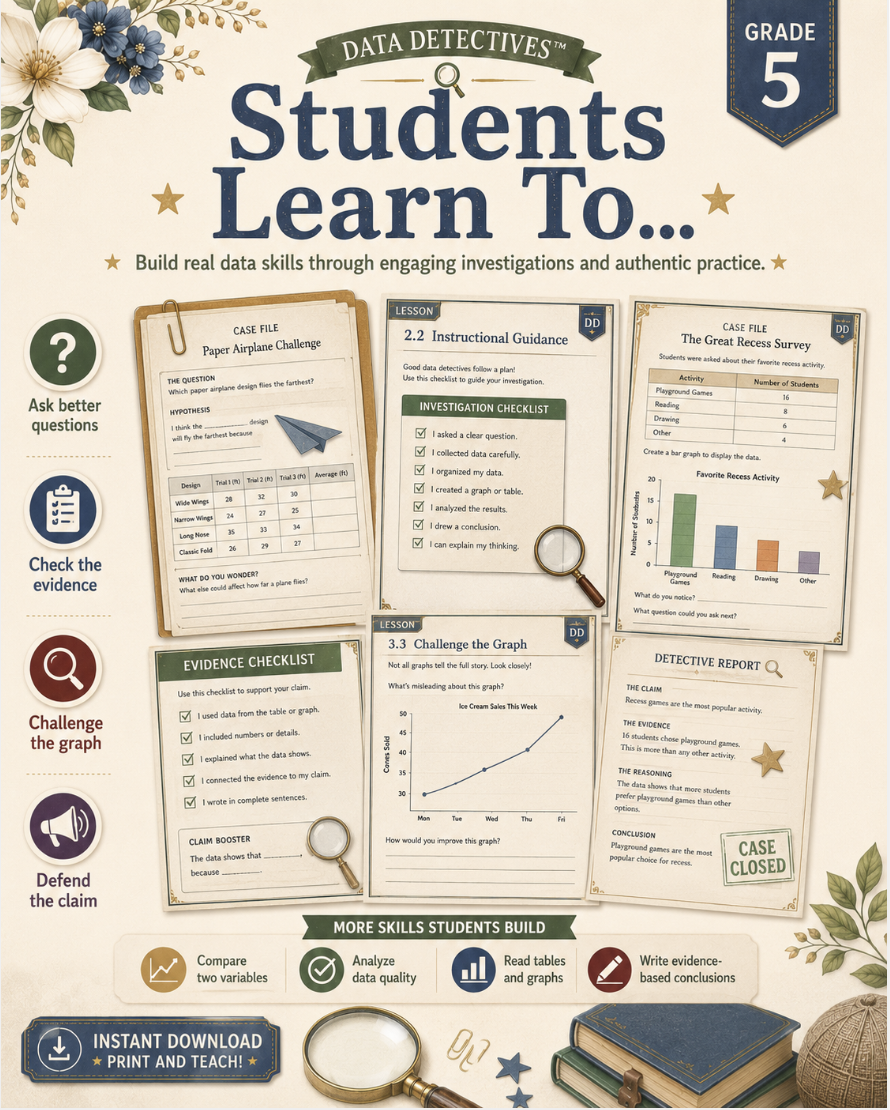 Image 3 of 4
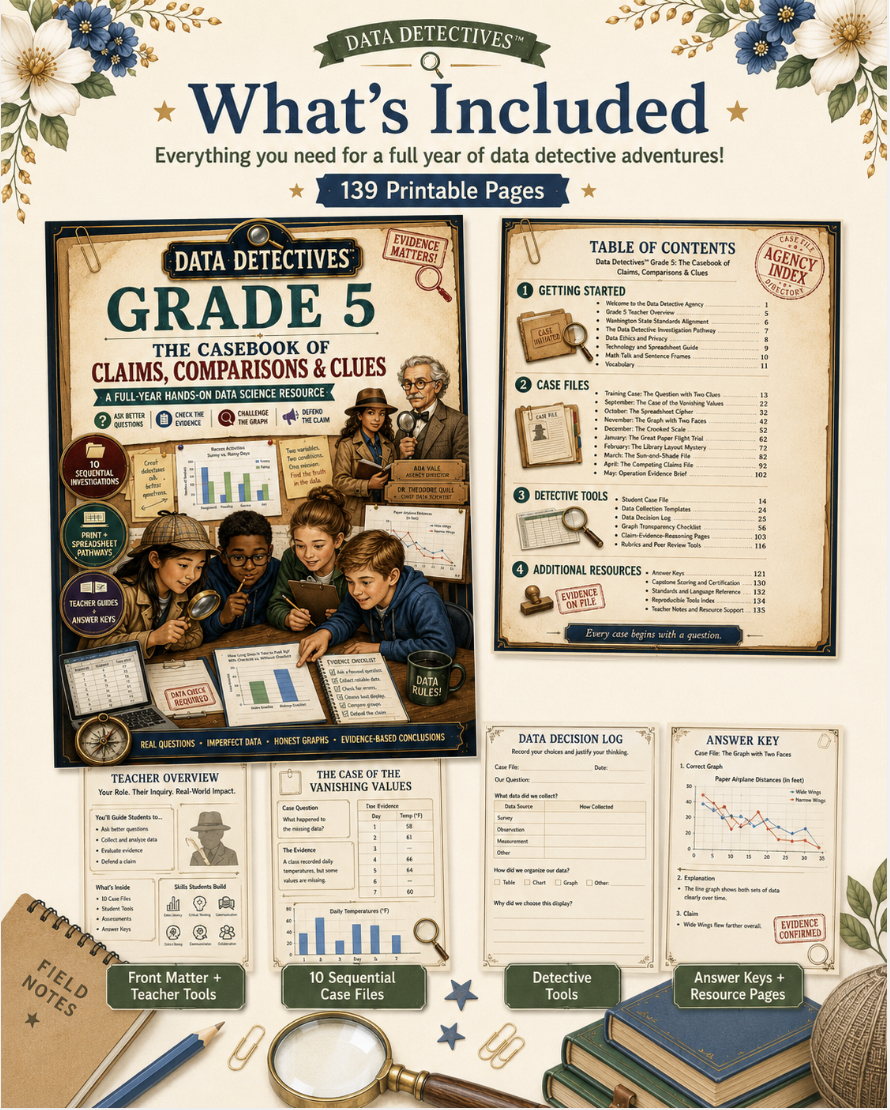 Image 4 of 4
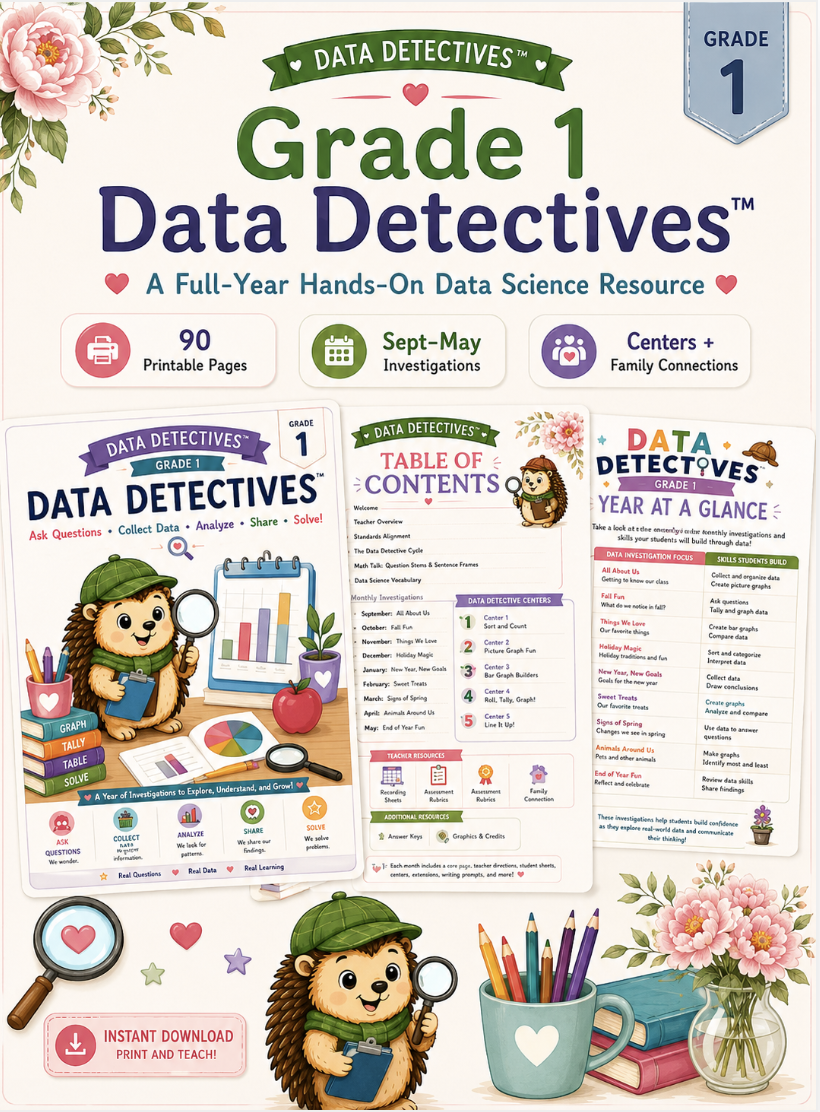
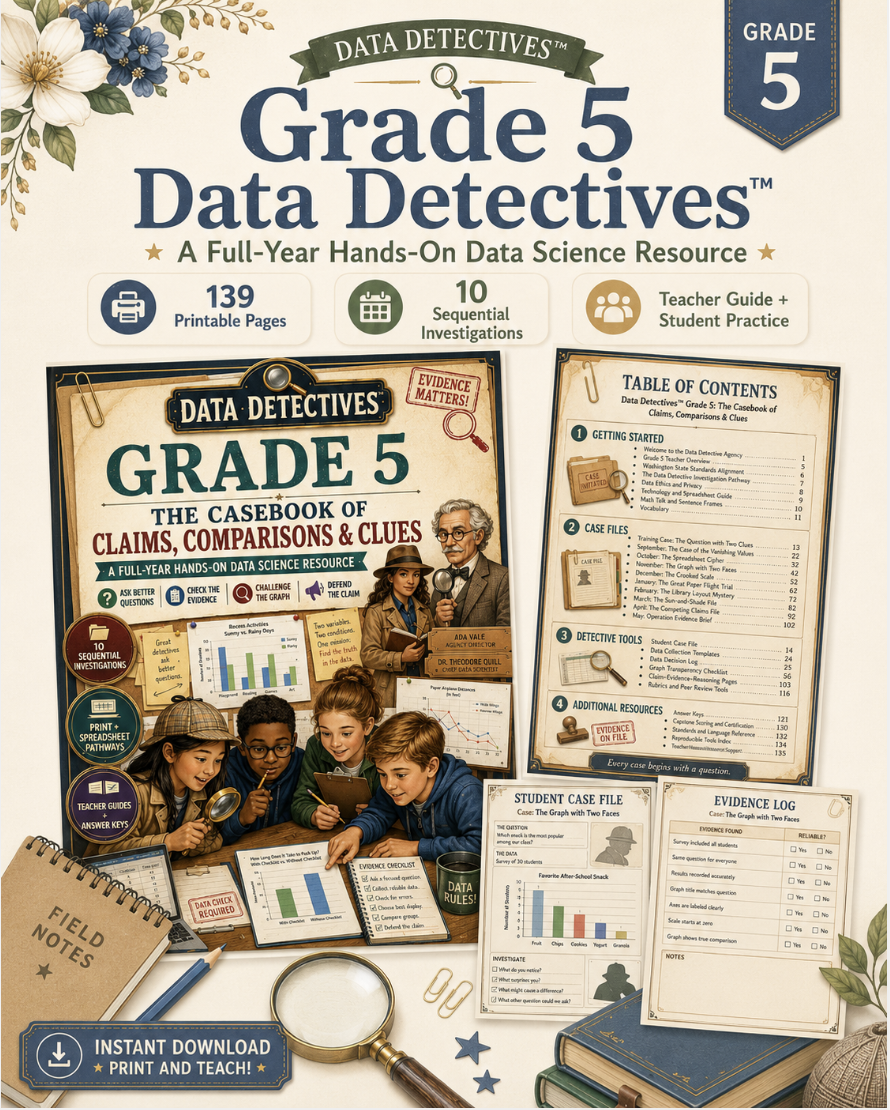
Welcome to the Data Detective Agency, where every number is a clue and every conclusion must survive the evidence.
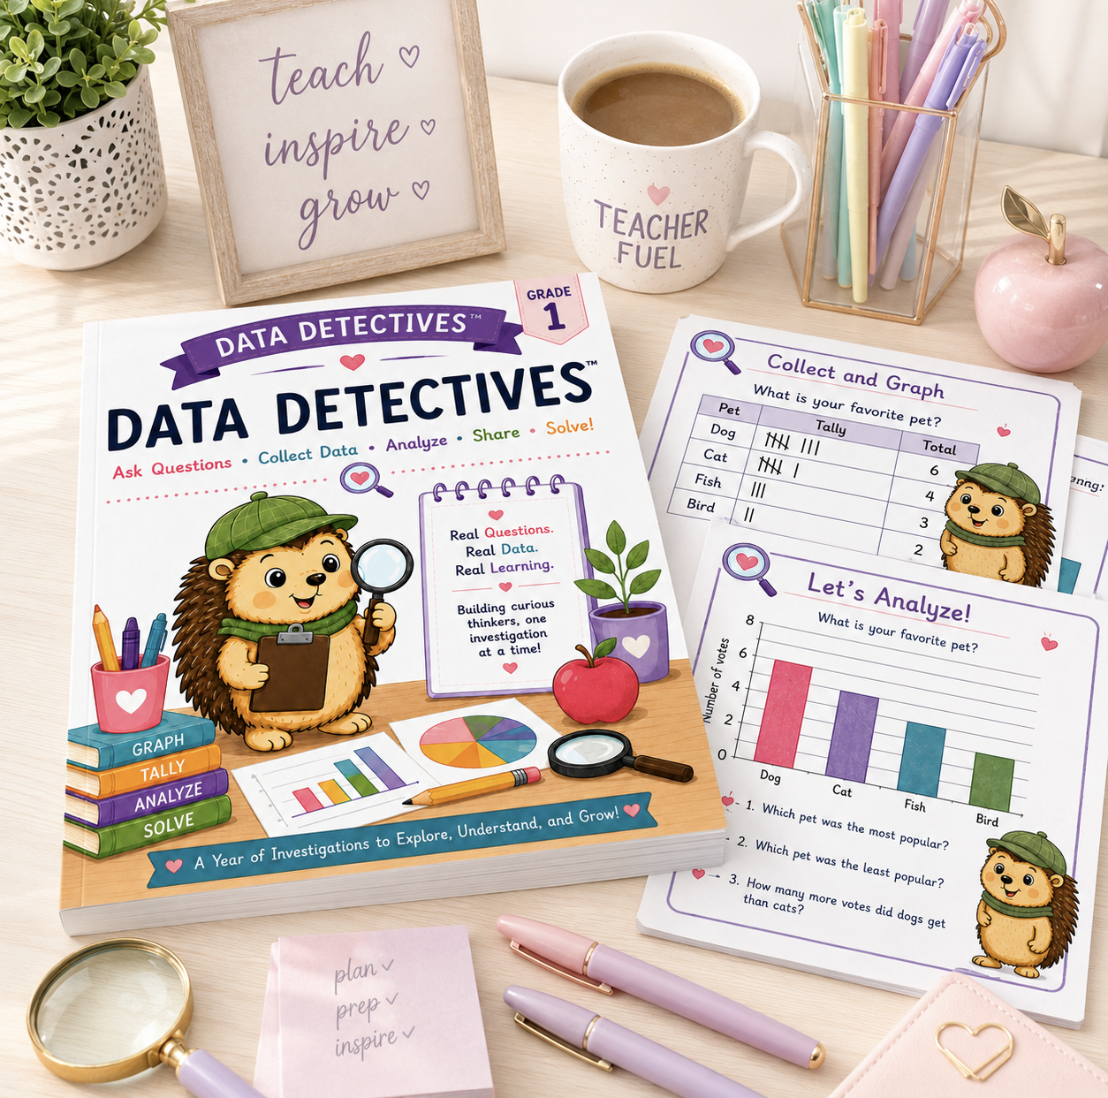
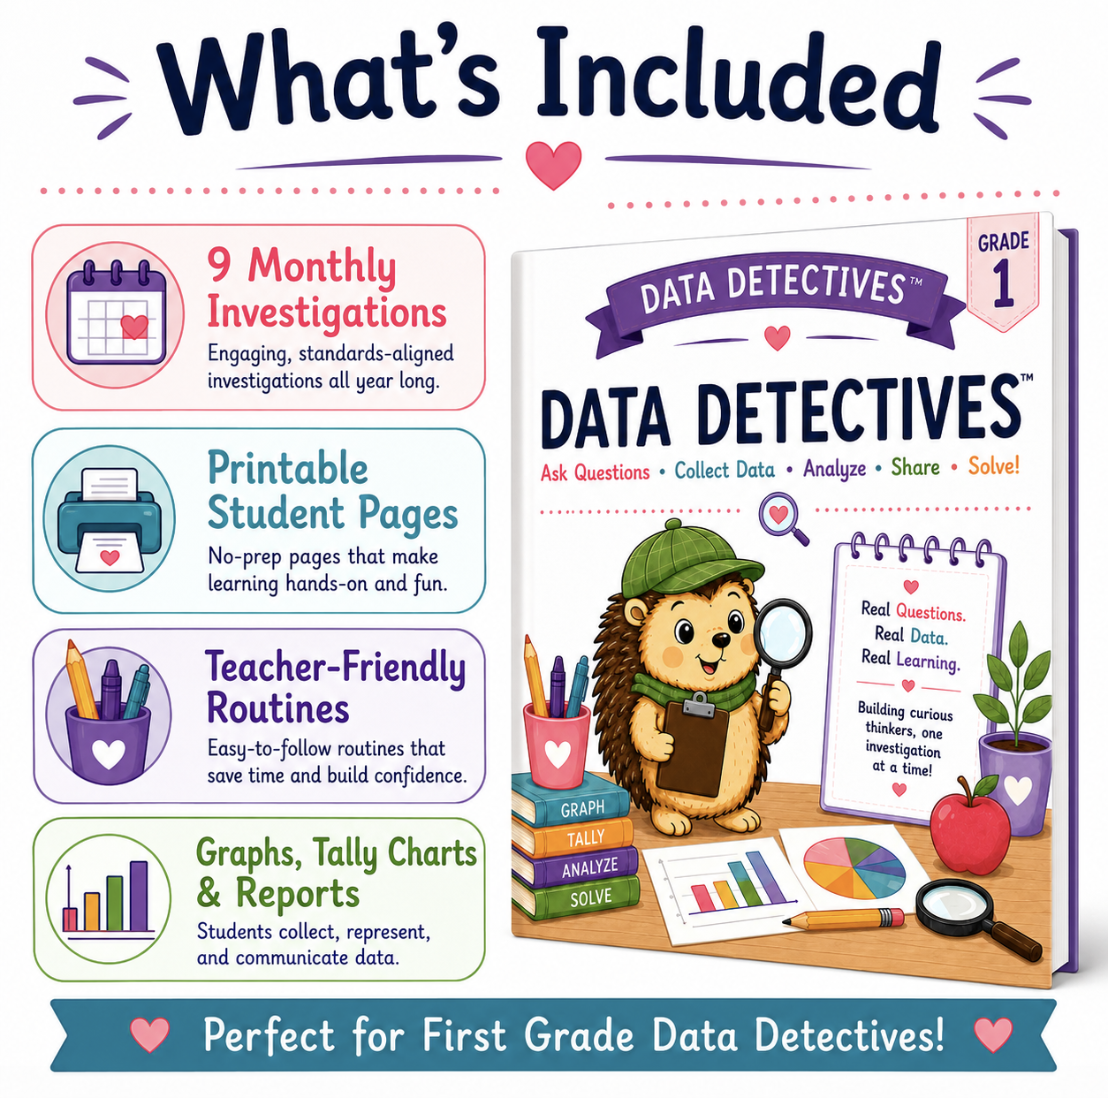
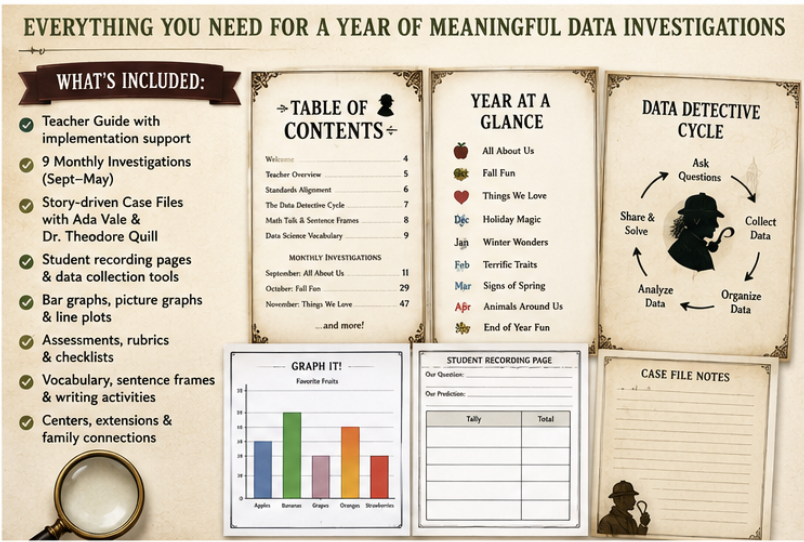
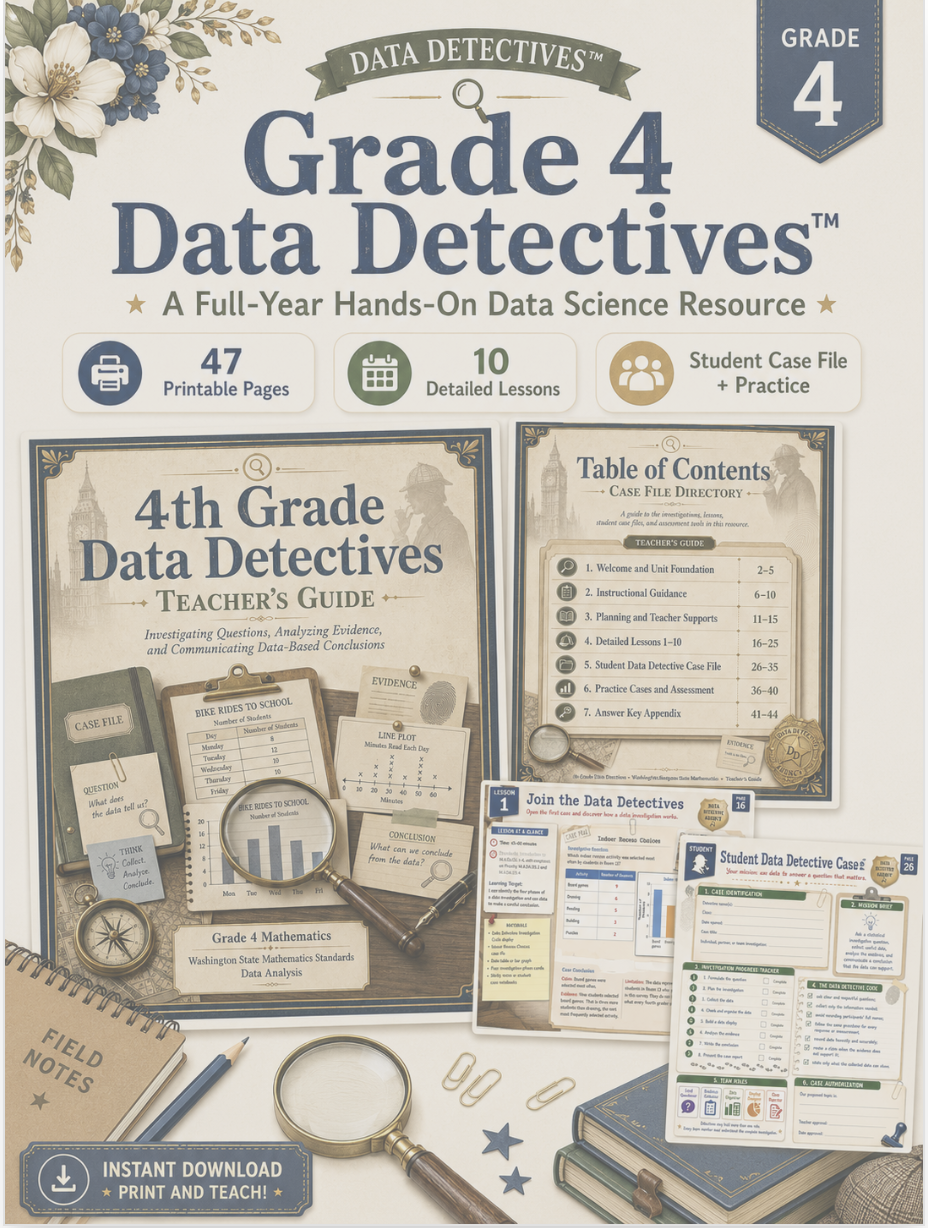
5th Grade Data Detectives™: The Casebook of Claims, Comparisons & Clues is a full-year data science resource that guides students through a training case and nine monthly investigations from September through May.
Students do far more than construct graphs. They examine how data were collected, identify missing or questionable values, document data-cleaning decisions, compare multiple representations, investigate misleading graph design, and determine what the evidence does and does not support.
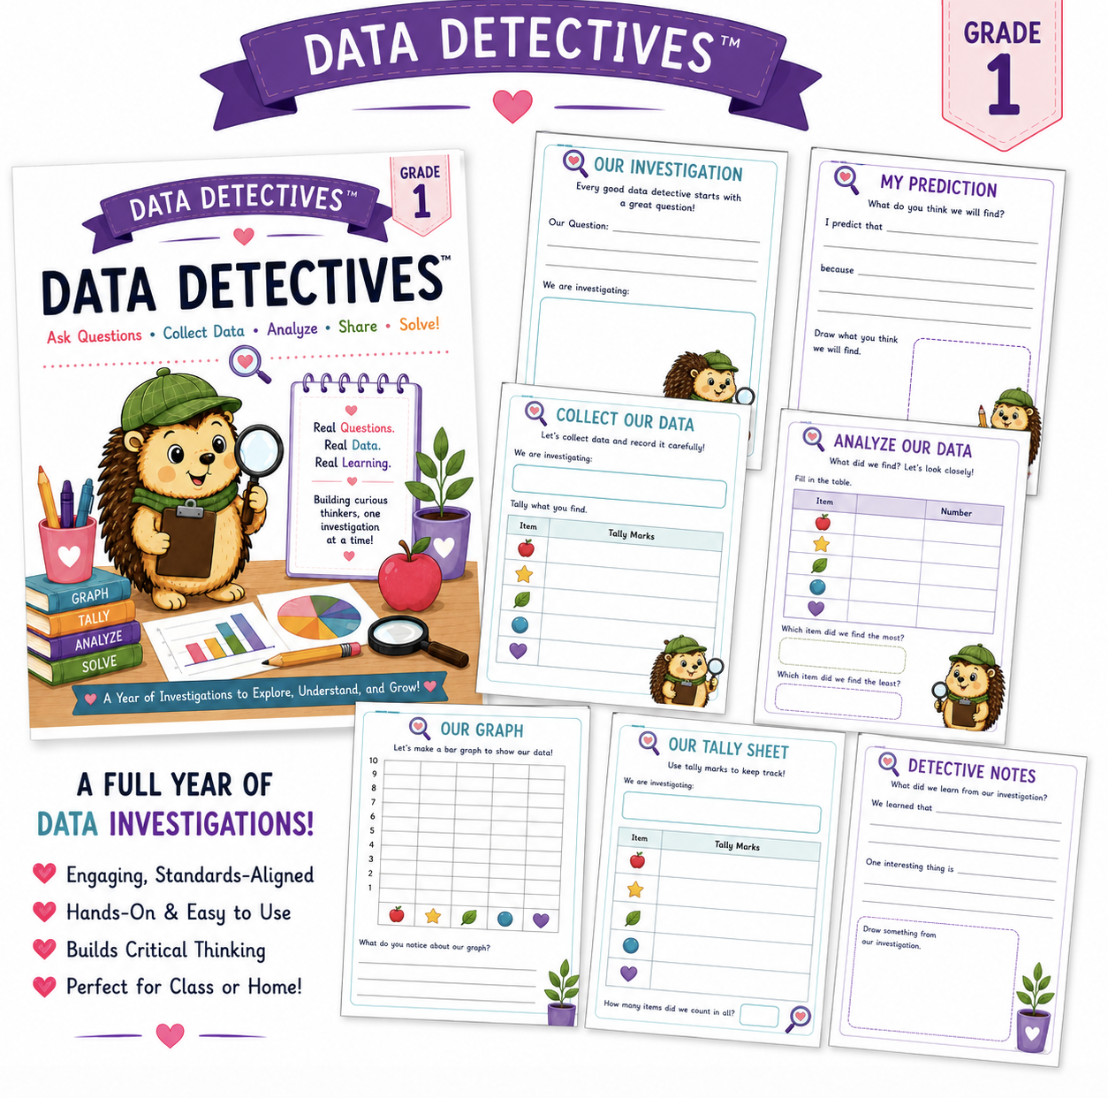
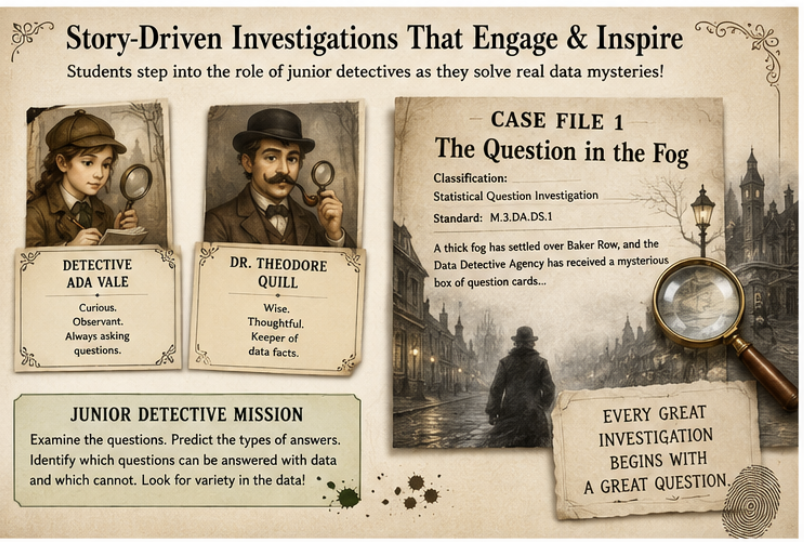
Each investigation combines an engaging case narrative with teacher guidance, student briefs, raw evidence, data-decision logs, visualizations, numerical reasoning, peer review, and evidence-based conclusions. The year culminates in Operation: Evidence Brief, an independent or team capstone in which students design and present a complete comparative data investigation.
The resource may be used as a monthly investigation sequence, a full-year data-analysis strand, an enrichment program, or a collection of performance tasks and assessments.
Training Case: The Question with Two Clues
Formulate and refine comparative statistical questions.
September: The Case of the Vanishing Values
Find missing, duplicate, inconsistent, and questionable data.
October: The Spreadsheet Cipher
Organize, sort, filter, standardize, and analyze spreadsheet data.
November: The Graph with Two Faces
Compare tables, grouped bar graphs, and spreadsheet-generated charts.
December: The Crooked Scale
Investigate truncated axes, unequal intervals, omitted evidence, distorted symbols, and loaded titles.
January: The Great Paper Flight Trial
Conduct repeated trials and compare numerical distributions with aligned line plots.
February: The Library Layout Mystery
Use matched searches and balanced condition order to compare search times.
March: The Sun-and-Shade File
Collect and compare matched-pair surface-temperature measurements.
April: The Competing Claims File
Audit two supported claims and decide which evidence is most relevant to a stated goal.
May: Operation Evidence Brief
Design, complete, review, and present an original comparative data investigation.
Formulate and refine statistical questions that compare two variables.
Identify the group, setting, variables, and expected variation.
Plan safe, ethical, and realistic data-collection procedures.
Protect privacy and use anonymous participant or location identifiers.
Preserve raw evidence and document every data decision.
Identify missing, duplicate, inconsistent, invalid, and questionable values.
Use tables, bar graphs, line plots, spreadsheets, and matched-pair displays.
Compare ranges, overlap, clusters, category counts, paired differences, and threshold success.
Distinguish an accurate display from a transparent display.
Analyze truncated scales, omitted information, distorted images, and unsupported titles.
Write claims supported by specific numerical evidence.
State limitations and avoid unsupported causal conclusions.
Challenge reasoning respectfully through peer review.
Communicate a complete evidence brief.
Grade 5 teacher overview
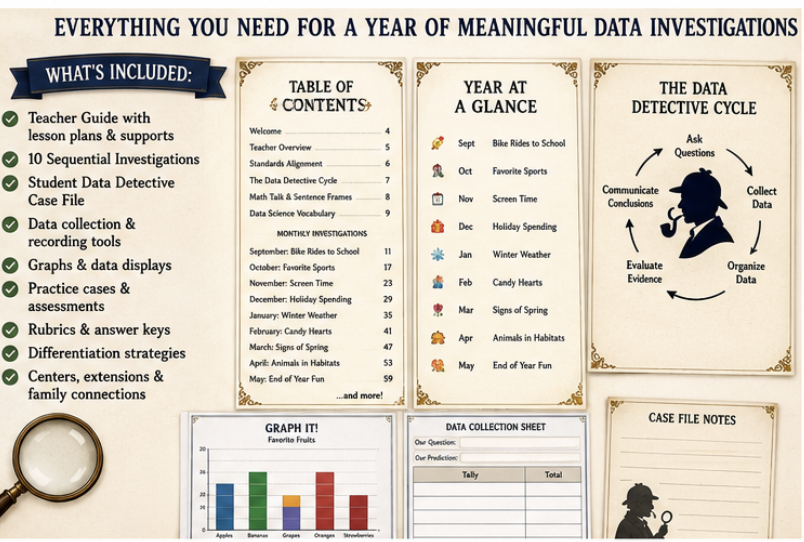
Full investigation pathway
Data ethics and privacy guidance
Technology-ready, technology-light, and no-device pathways
Spreadsheet anatomy and safety guidance
Math-talk prompts and evidence-based sentence frames
Grade 5 data-analysis vocabulary
Year-at-a-glance investigation sequence
Teacher intelligence pages for every case
Standards focus and learning goals
Suggested pacing
Materials and preparation guidance
Common misconceptions and teacher responses
Differentiation and language supports
Teacher look-fors
Assessment strips and scoring guidance
Case answer keys
Capstone teacher key
24-point capstone scoring guide
Lead Data Investigator certificate
Standards and language reference pages
Reproducible tools index
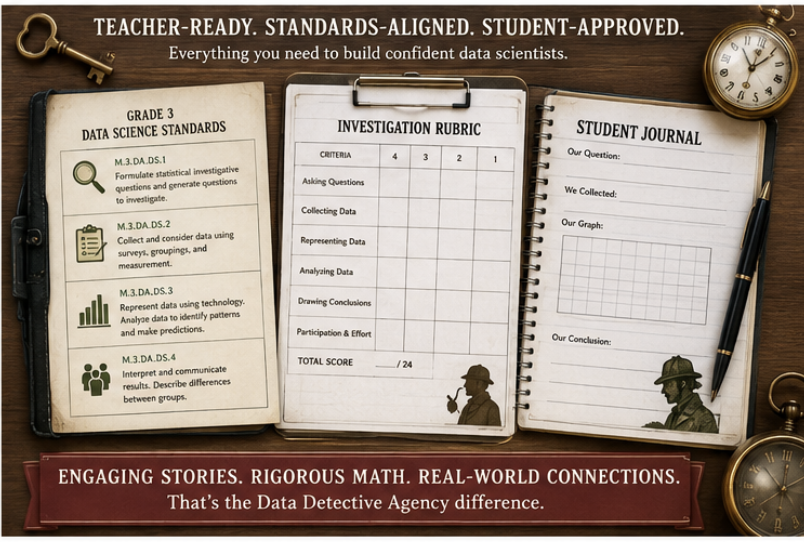
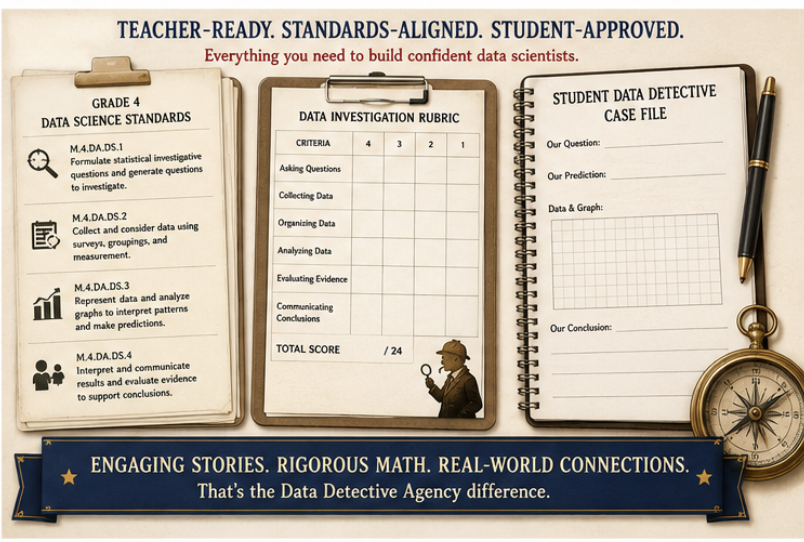
The resource aligns to the current Washington Grade 5 Data Analysis strand:
M.5.DA.DS.1: Formulate statistical investigative questions.
M.5.DA.DS.2: Collect and consider data, including data-quality decisions.
M.5.DA.DS.3: Analyze and compare data visualizations.
M.5.DA.DS.4: Interpret results and communicate evidence-based conclusions.
The resource gives priority attention to M.5.DA.DS.3 and M.5.DA.DS.4 while integrating the complete inquiry cycle across all four standards. Current OSPI mathematics materials list these Grade 5 Data Analysis codes and describe the WA Math 2026 standards as centering the data science inquiry cycle.
Welcome to the Data Detective Agency, where every number is a clue and every conclusion must survive the evidence.
5th Grade Data Detectives™: The Casebook of Claims, Comparisons & Clues is a full-year data science resource that guides students through a training case and nine monthly investigations from September through May.
Students do far more than construct graphs. They examine how data were collected, identify missing or questionable values, document data-cleaning decisions, compare multiple representations, investigate misleading graph design, and determine what the evidence does and does not support.
Each investigation combines an engaging case narrative with teacher guidance, student briefs, raw evidence, data-decision logs, visualizations, numerical reasoning, peer review, and evidence-based conclusions. The year culminates in Operation: Evidence Brief, an independent or team capstone in which students design and present a complete comparative data investigation.
The resource may be used as a monthly investigation sequence, a full-year data-analysis strand, an enrichment program, or a collection of performance tasks and assessments.
Training Case: The Question with Two Clues
Formulate and refine comparative statistical questions.
September: The Case of the Vanishing Values
Find missing, duplicate, inconsistent, and questionable data.
October: The Spreadsheet Cipher
Organize, sort, filter, standardize, and analyze spreadsheet data.
November: The Graph with Two Faces
Compare tables, grouped bar graphs, and spreadsheet-generated charts.
December: The Crooked Scale
Investigate truncated axes, unequal intervals, omitted evidence, distorted symbols, and loaded titles.
January: The Great Paper Flight Trial
Conduct repeated trials and compare numerical distributions with aligned line plots.
February: The Library Layout Mystery
Use matched searches and balanced condition order to compare search times.
March: The Sun-and-Shade File
Collect and compare matched-pair surface-temperature measurements.
April: The Competing Claims File
Audit two supported claims and decide which evidence is most relevant to a stated goal.
May: Operation Evidence Brief
Design, complete, review, and present an original comparative data investigation.
Formulate and refine statistical questions that compare two variables.
Identify the group, setting, variables, and expected variation.
Plan safe, ethical, and realistic data-collection procedures.
Protect privacy and use anonymous participant or location identifiers.
Preserve raw evidence and document every data decision.
Identify missing, duplicate, inconsistent, invalid, and questionable values.
Use tables, bar graphs, line plots, spreadsheets, and matched-pair displays.
Compare ranges, overlap, clusters, category counts, paired differences, and threshold success.
Distinguish an accurate display from a transparent display.
Analyze truncated scales, omitted information, distorted images, and unsupported titles.
Write claims supported by specific numerical evidence.
State limitations and avoid unsupported causal conclusions.
Challenge reasoning respectfully through peer review.
Communicate a complete evidence brief.
Grade 5 teacher overview
Full investigation pathway
Data ethics and privacy guidance
Technology-ready, technology-light, and no-device pathways
Spreadsheet anatomy and safety guidance
Math-talk prompts and evidence-based sentence frames
Grade 5 data-analysis vocabulary
Year-at-a-glance investigation sequence
Teacher intelligence pages for every case
Standards focus and learning goals
Suggested pacing
Materials and preparation guidance
Common misconceptions and teacher responses
Differentiation and language supports
Teacher look-fors
Assessment strips and scoring guidance
Case answer keys
Capstone teacher key
24-point capstone scoring guide
Lead Data Investigator certificate
Standards and language reference pages
Reproducible tools index
The resource aligns to the current Washington Grade 5 Data Analysis strand:
M.5.DA.DS.1: Formulate statistical investigative questions.
M.5.DA.DS.2: Collect and consider data, including data-quality decisions.
M.5.DA.DS.3: Analyze and compare data visualizations.
M.5.DA.DS.4: Interpret results and communicate evidence-based conclusions.
The resource gives priority attention to M.5.DA.DS.3 and M.5.DA.DS.4 while integrating the complete inquiry cycle across all four standards. Current OSPI mathematics materials list these Grade 5 Data Analysis codes and describe the WA Math 2026 standards as centering the data science inquiry cycle.